September became the most dramatic month in the dataset


Here is wholesale electricity prices in the UK looked like in September. The month opened with nine continuous days of above £113/MWh, peaking at £211.20/MWh on 13 September. Next day, the price decreased slightly and reached £193.19/MWh.
The week of 13–16 September averaged over £175/MWh. Gas became dominant and renewable output was insufficient to decrease prices.
The following week, the grid situation flipped completely. There were four consecutive days of high renewable energy that produced some of the most extreme readings in recent months.
By 19 September, the price averaged just £22.39/MWh. That was actually the cheapest day in the entire dataset with 16 negative price periods and a CV of 1.894.
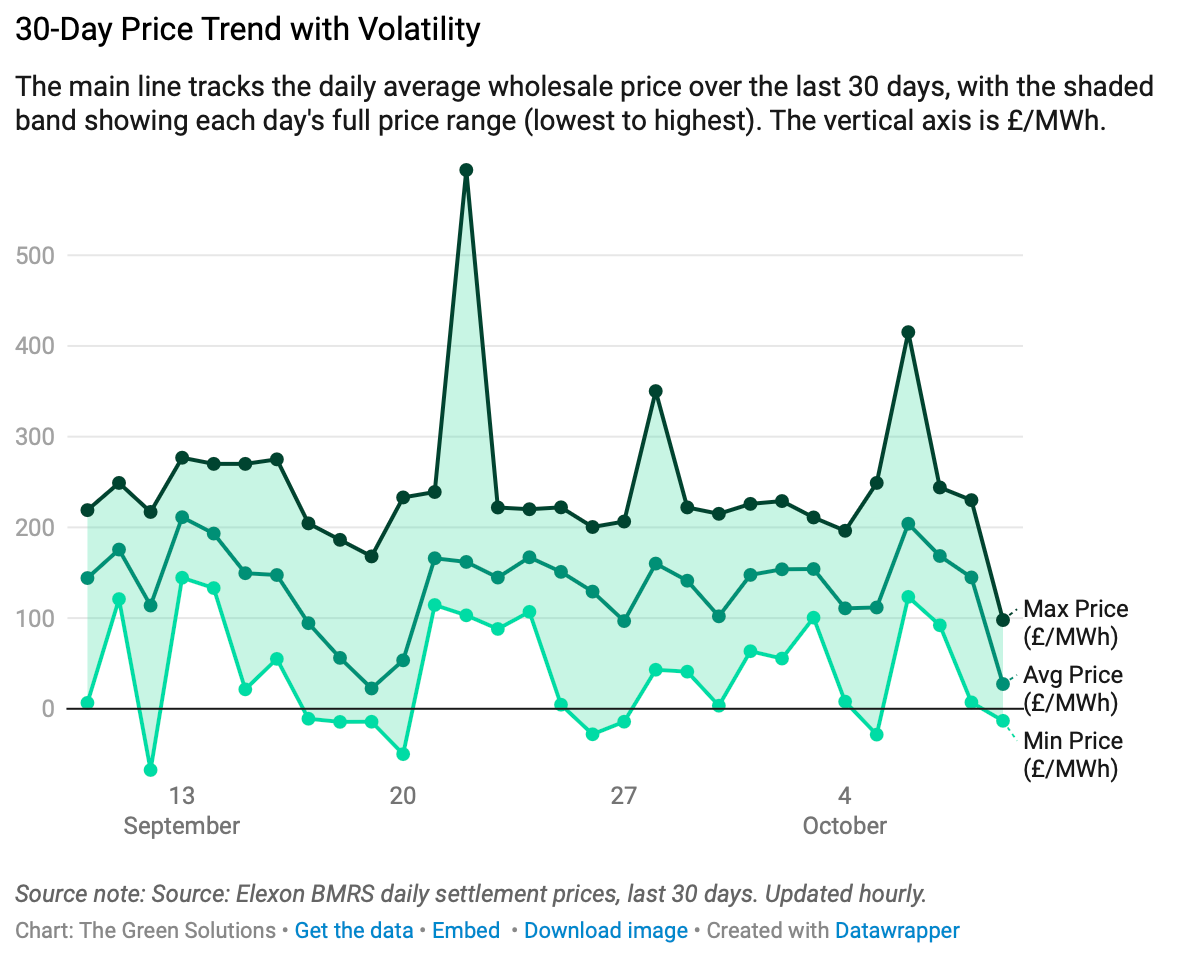
There were 93 negative price periods were recorded across the entire 30-day window (Figure 1) and the vast majority concentrated in this four-day window.
Gas becomes dominant again
From 21st September onwards, gas returned. Daily averages climbed back above £140/MWh for most of the final week, with 22th September producing a remarkable intraday peak of £594/MWh. That is the single highest settlement period price in the entire 30-day dataset.
The month ended at £101.92/MWh, which is cheaper than it started, but with October already is showing renewed gas dominance.
The 30-day numbers:
- Average price: £138.28/MWh
- Highest price: £594/MWh (22 September)
- Lowest price: -£67.50/MWh (12 September)
- Total range: £661.50/MWh
- Negative price periods: 93
- Average volatility CV: 0.528 (high)