Why did UK electricity go negative three times last week?

Data are sourced from Elexon BMRS half-hourly settlement prices and NESO Data Portal. The merit order suppression model is based on Cludius et al. (2014) and Clò et al. (2015). Carbon calculations use UK ETS price of £45/tonne and DESNZ 2024 grid factor of 181 gCO₂/kWh.
Caption: Lower line = real UK wholesale price, half-hourly. Upper line = what it would’ve cost without renewables. That gap is wind and solar earning their keep. Snapshot from Sunday evening, ~23:00.
Predictable Monday and Tuesday, 3rd and 4th August
The average price was £122.33/MWh on Monday with a CV of just 0.233. The price decreased slightly to £114.12/MWh on Tuesday but still there were no negative periods.
That’s two days of high gas-dominated but predictable prices, a bit boring honestly. It looked comfortable for fixed-rate contracts but for flexible tariffs, there is not much to offer.
Wednesday recorded the deep negative price
On Wednesday, the story became different. We saw the most striking single data point of recent months. The average price fell to £88.45/MWh as wind energy activated more and within that average occurred eight settlement periods of negative prices.
That’s the deepest negative price in the 30-day dataset. This means the grid was paying consumers nearly £48 per MWh to use electricity during off-peak hours while the same day’s peak reached £164.50/MWh.
Volatility CV hit 0.733 on the same day. That’s high but not the week’s worst, because the negative periods were found in off-peak hours rather than spread across the day.
Gas returned on Thursday and Friday
On Thursday, the price increased sharply to £126.36/MWh. That is a £38/MWh jump from Wednesday’s average as gas stepped in. The CV rose to 0.410 as prices became more volatile without the renewable’s support.
On Friday, the price decreased slightly with a CV of 0.408 but still showed gas-dominated. There were no negative prices on either day.
This pattern is quite common in the UK grid. A renewable increase creates negative prices but the gas is needed again within 24-48 hours, which increases the price. This transition is so fast that the buyers who can’t respond in half-hourly windows miss both the opportunity and the warning.
Negative prices returned again on weekend
The weekend brought another wave of renewable generation. On Saturday, the tool recorded 14 negative price periods with prices falling to -£14.47/MWh. The average for the day was just £82.38/MWh despite a peak of £185/MWh.
At the time of writing this article, it’s Sunday at around 23:00. So far, 45 periods and has recorded 8 negative price periods with prices decreasing to -£14.07/MWh. The day’s average so far is £95.44/MWh with a CV of 0.625. This is another volatile day of mixed renewable and gas generation.
We can see the weekend pattern quite well now. The renewable increases and pushes prices negative during off-peak hours whereas gas fills the gaps during peak demand.
Observation: There were three separate days of negative prices this week (Wednesday, Saturday, and Sunday). A client on a half-hourly flexible contract who consumed during those negative periods was paid to use electricity on three separate occasions. A client on a fixed tariff paid their contracted rate throughout.
Caption: Daily average wholesale price, last 30 days. Shaded band = full range between cheapest and priciest half-hour each day. Wednesday’s the widest band of the week, unsurprisingly.
The storage picture
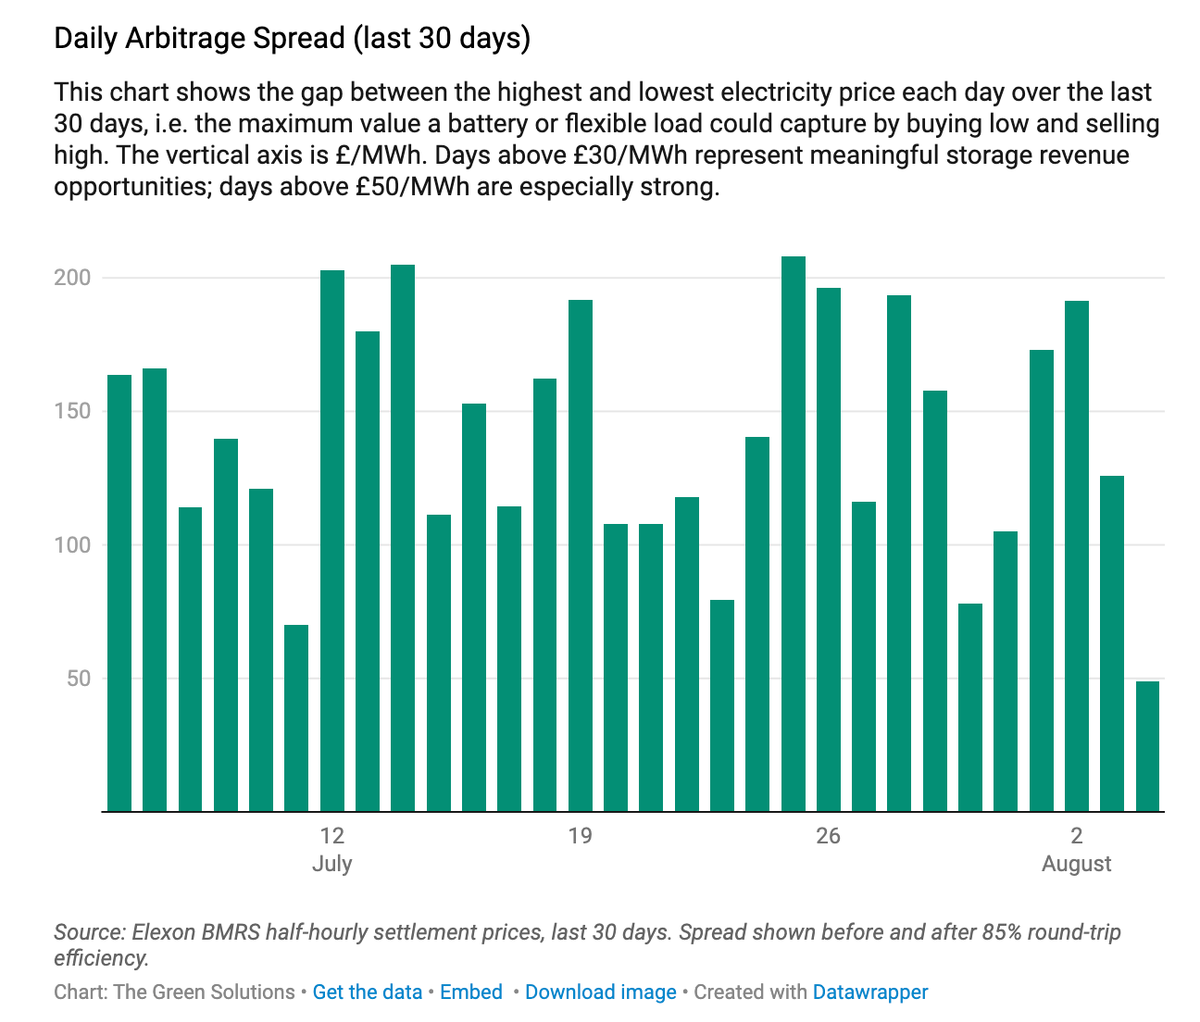
Wednesday’s -£48/MWh low combined with a £164.50/MWh peak produced the maximum single-day price gap of £212.50/MWh (the highest in the 30-day dataset). Across all 30 days, the average daily price gap stands at £153.22/MWh and with the net price gap after 85% round-trip efficiency: £112.12/MWh.
Every single day in the 30-day dataset recorded a price gap above both the £30 and £50 commercial viability thresholds. The floor remains at £70/MWh.
Caption: The daily price gap between the highest and lowest electricity price over the last 30 days. Every bar is one day’s storage opportunity. Wednesday has the widest bar in the dataset at £212.50/MWh.
The week ahead
It’s August, so a holiday period for most. Most industries have fewer operations, offices are half empty, schools and universities are closed. This lowers consumption, which increases the gap between supply and demand during off-peak hours. The lower consumption means renewables likely push negative prices.
We expect more frequency of negative price periods with an average renewable share around 32% and average prices of approximately £93/MWh. Grid carbon intensity is estimated around 101 gCO₂/kWh.
But keep an eye on September. The seasonal model is signalling that September may bring tighter conditions as summer renewable output begins to fade and heating demand edges back in.