Why electricity bills will keep rising even as energy gets cheaper
Our electricity bills are not determined at the point of generation, but by the cost of moving, balancing, and stabilizing electricity across the grid. As the system becomes more complex, the cost of the grid itself is becoming one of the most important drivers of future electricity prices.
Governments and utilities are investing in modernising ageing infrastructure, connecting renewable energy projects that are often located far from major demand centres, and strengthening resilience against physical and cyber risks.
At the same time, electricity demand is rising quickly due to electrification, use of electric vehicles, heat pumps, and the rapid growth of data centres and AI infrastructure.
As demand increases and grid systems expand to support more renewable energy, utilities are expected to experience one of the largest infrastructure investment cycles in decades.
Global electricity demand is increasing rapidly
Over the period from 2026 to 2030, global power demand is expected to grow at a compound annual growth rate of around 3.6%, which is roughly 50% higher than in the previous decade. A large part of this growth comes from structural changes in how economies use electricity.
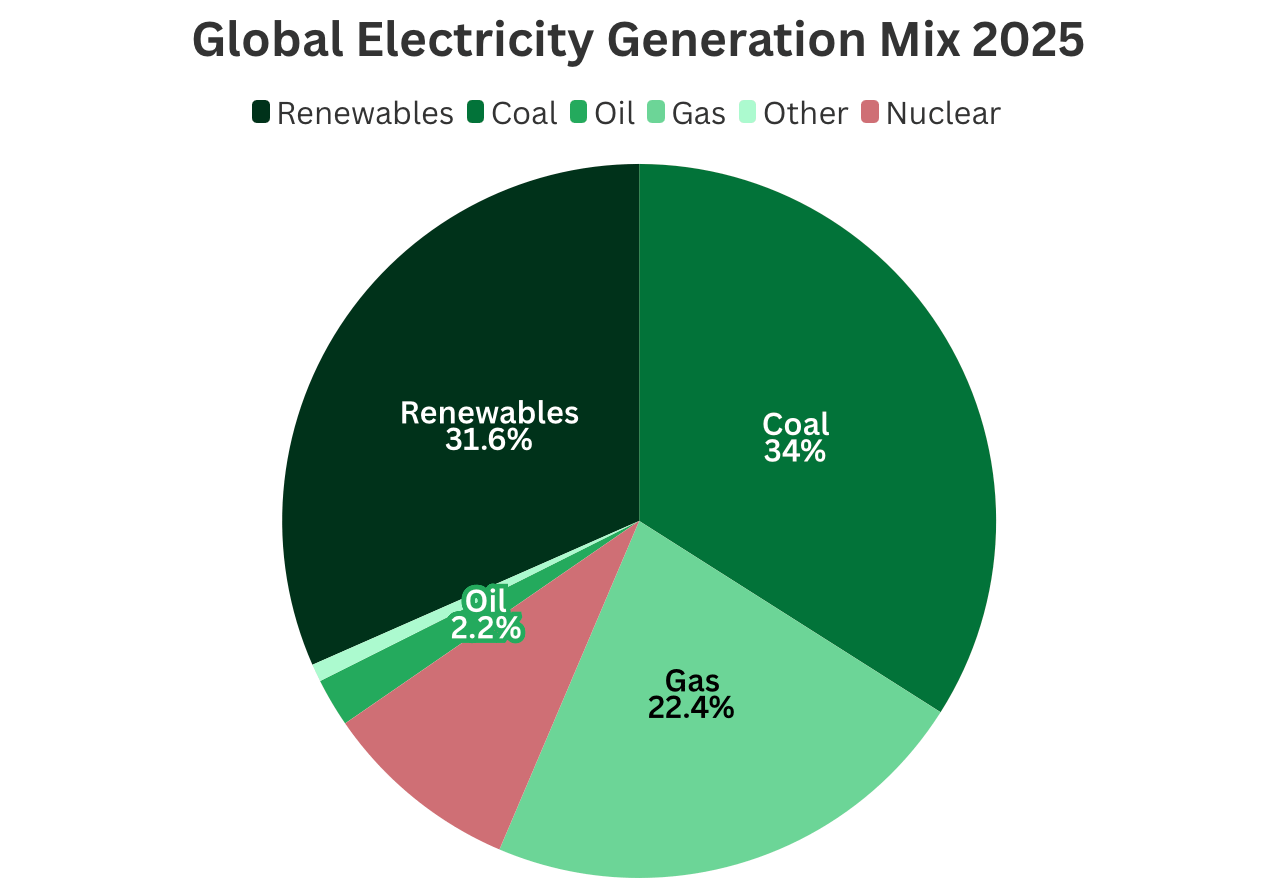
Figure 1 shows the global electricity generation mix in 2025. Although renewables make up about 32%, they come with some challenges. Unlike traditional fossil fuel and nuclear plants, which were often built close to cities and industrial centres, renewable energy projects are usually located in remote or offshore areas.
Read: Disadvantages of renewable energy
In the UK, for example, a large share of new wind generation is based in offshore zones and northern Scotland, while most electricity demand is in England.
This requires major new transmission infrastructure, including thousands of kilometres of high-voltage cables, upgraded substations, and stronger local distribution networks.
Industry estimates suggest that these upgrades could cost tens of billions of pounds over the next decade.
Global grid investment
On a global scale, grid spending has increased from around USD 300 billion in 2020 to approximately USD 480 billion in 2025, and it is expected to rise further.
Between 2026 and 2035, total global investment in grid infrastructure is projected to reach around USD 5.8 trillion (Figure 2). Of this total, about 12% is expected to go toward digital grid technologies, such as advanced monitoring systems, forecasting tools, and software-based optimisation.

In the U.S. alone, grid investment is expected to reach around USD 1 trillion over the coming decade, with about 37% allocated to transmission networks and 63% to distribution systems. It is important to note that most of these costs are eventually recovered through electricity bills.
Electricity prices are made up of several components, including the cost of generating electricity, transmission networks, local distribution systems, balancing services, maintenance, system upgrades, and the integration of renewable energy.
As utilities invest more in grid expansion and reinforcement, network charges increase and gradually make up a larger share of our electricity bills.
Why grids are becoming more expensive
More than 40% of distribution infrastructure in some countries, especially in Europe, is over 40 years old. This means large parts of the grid are approaching or have already passed their intended design life.
At the same time, the grid must adapt to a system that is no longer centralised, but instead flows in multiple directions due to distributed solar, wind, and storage. This change requires not only new physical infrastructure, but also advanced digital systems that can manage complex electricity flows in real time.
At the same time, building new grid infrastructure is becoming more complex and time-consuming. Planning, permitting, and constructing transmission projects can take anywhere from 5 to 15 years.
In comparison, renewable energy projects, such as wind and solar farms typically take 1 to 5 years to develop, data centres take 1 to 3 years, and EV charging infrastructure can be deployed in 1 to 2 years.
Read: Could wind and solar farms coexist with agriculture?
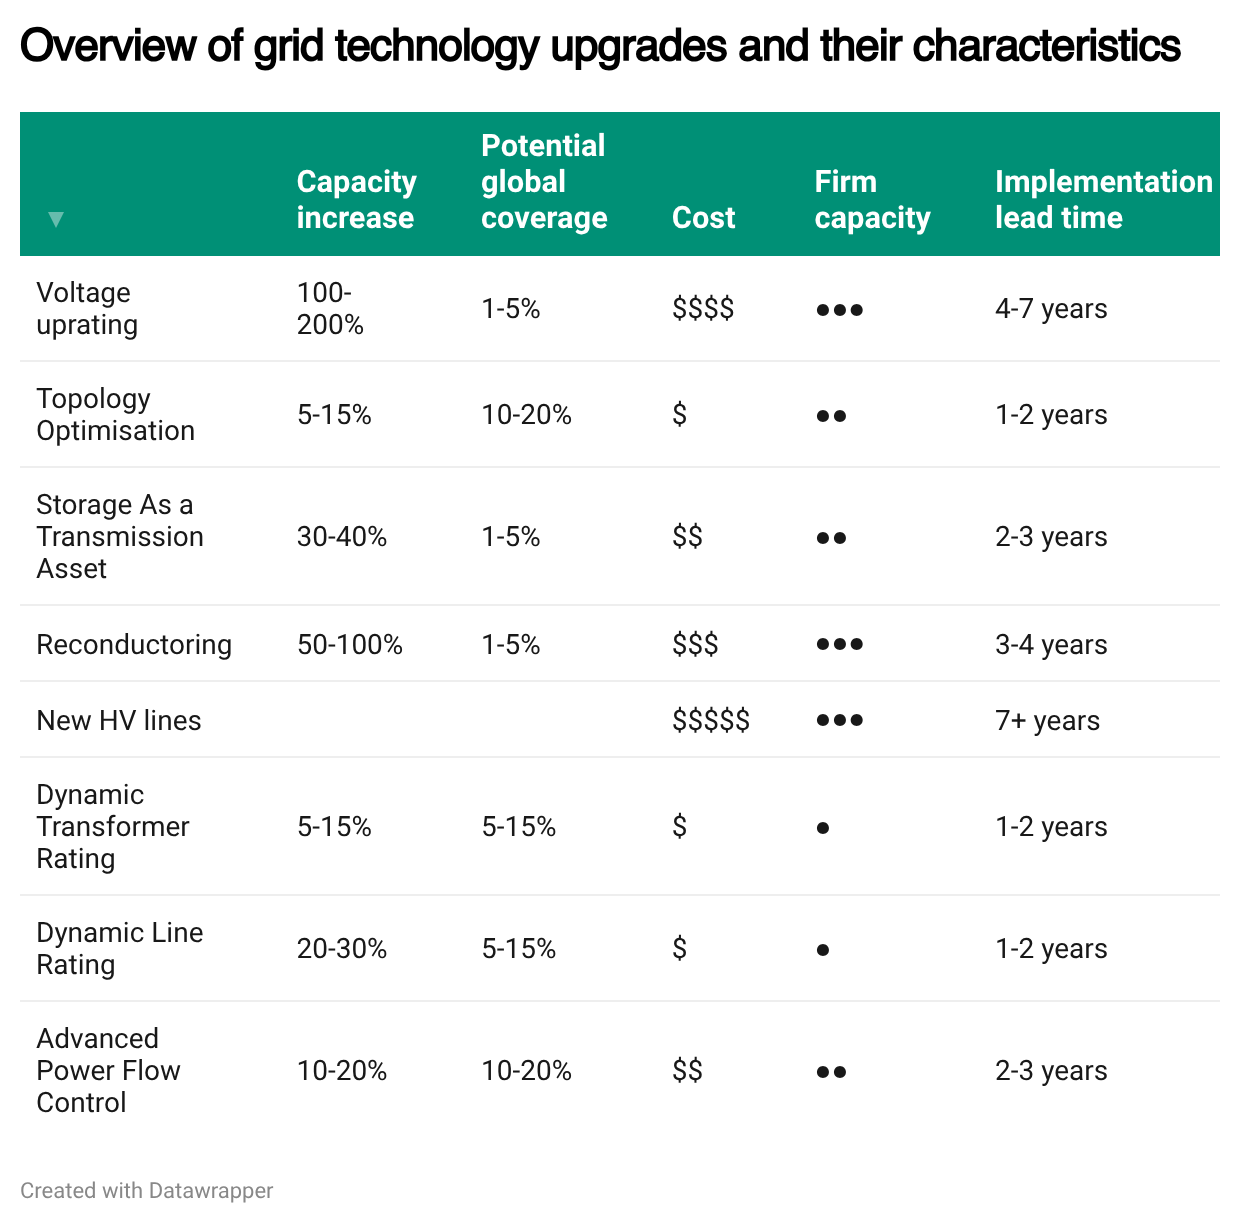
Figure 3 shows different types of grid upgrades, along with their cost, capacity potential, and implementation time. Among these, new high-voltage (HV) lines and voltage uprating are the most expensive and time-consuming, both financially and in terms of delivery time.
This gap between the speed of demand growth and the speed of grid expansion is one of the main structural challenges in the energy system today.
How rising grid costs affect electricity bills
As utilities spend more on upgrading cables and transformers, regulators typically allow them to recover these costs through higher regulated tariffs. So, even low-energy users may see their bills rise, because part of the bill is linked to infrastructure costs rather than just how much electricity is used.
This means, we also pay for:
- Transmission networks
- Local distribution systems
- Balancing services
- Grid maintenance
- System upgrades
- Renewable integration costs
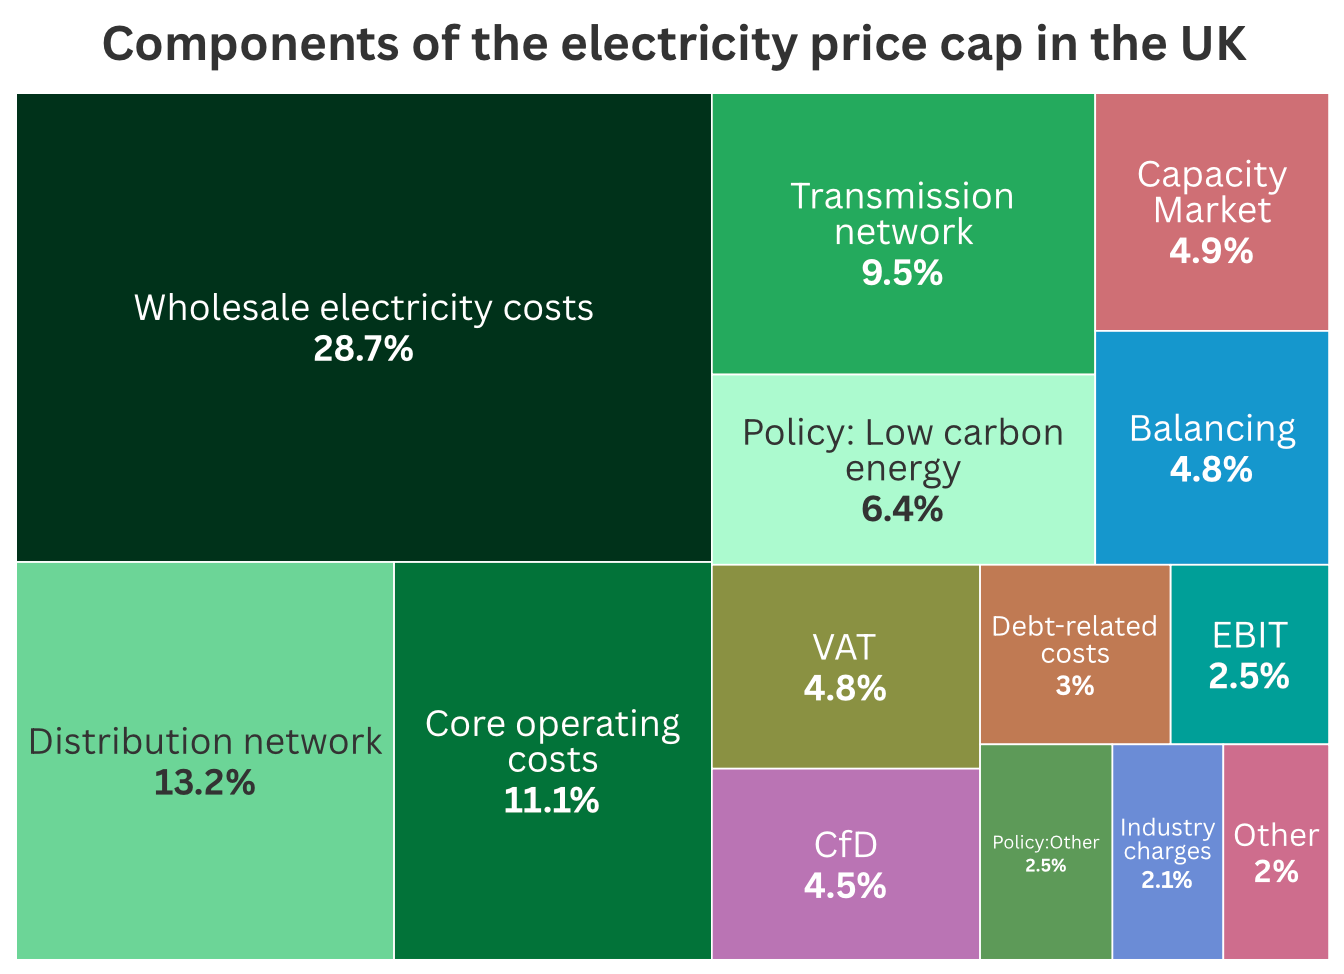
The wholesale market is where electricity producers sell electricity, and it is the main driver of wholesale costs. It consists of wholesale electricity prices, the capacity market, and CfDs (Contracts for Difference). This typically makes up about 38% of the price cap.
Read: How climate change is increasing your household bills
Electricity bills are also affected indirectly by higher balancing and system costs. The grid must constantly match supply and demand in real time. As more renewable energy, such as wind and solar, which are often located far from cities, enters the system, grid operators need more interventions to keep the system stable.
Balancing costs and renewable integration
Even when renewable energy is producing at full capacity, there are times when electricity cannot be delivered to where it is needed because the grid is full or has limited capacity.
In these cases, system operators may pay renewable generators to temporarily reduce their output. As a result, some local demand is met using fossil fuel power, such as gas or coal plants.
Read: The critical role of power sources in the climate crisis
Read: Energy security concerns lead to more coal production
When combined with rising grid and network charges, this creates a situation where households are exposed to both fuel price volatility and rising infrastructure costs.
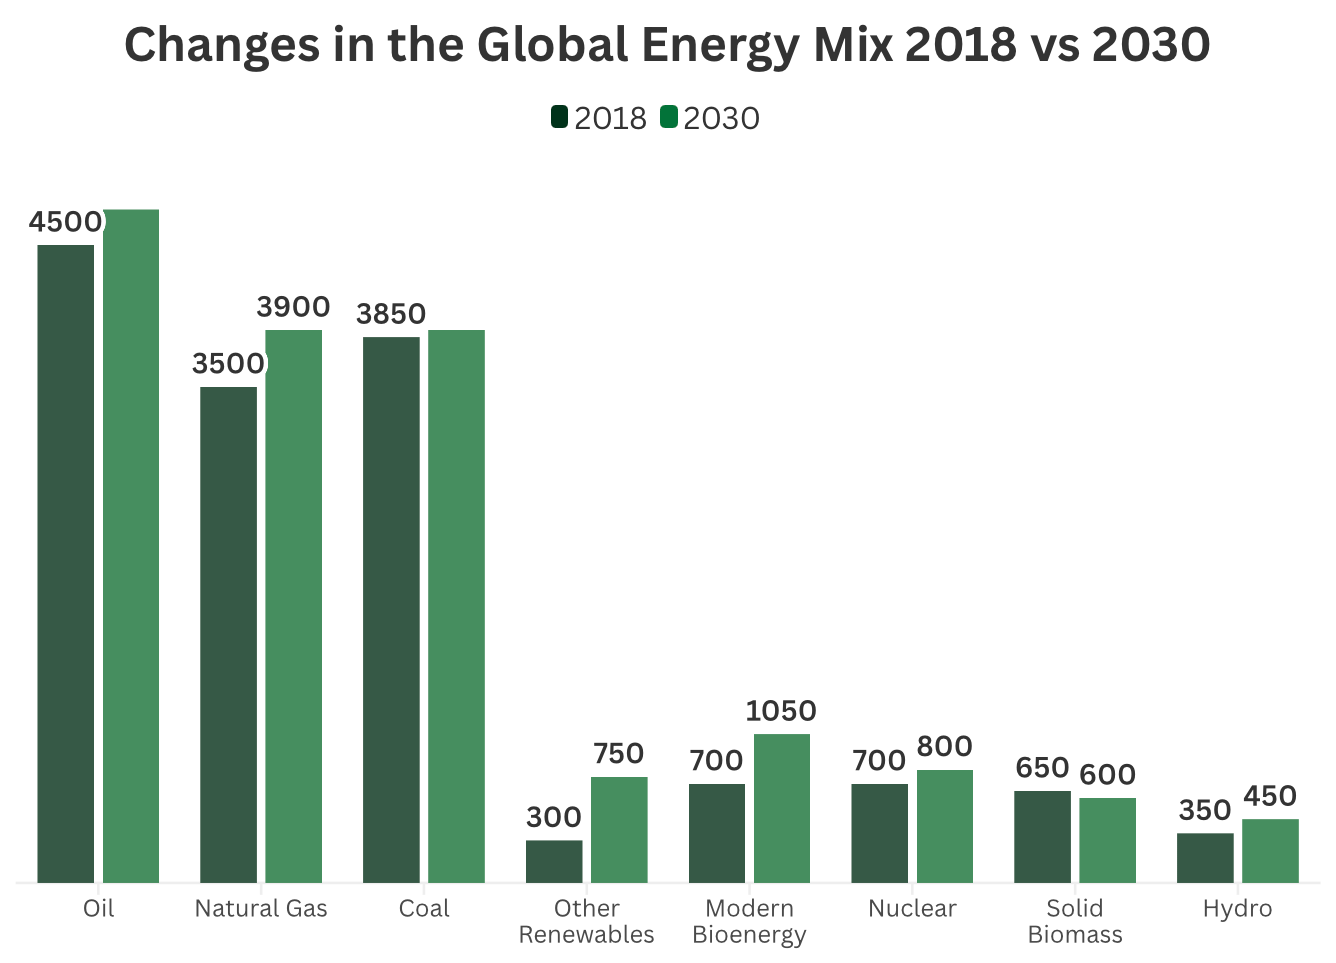
Figure 5 shows the projected change in the global energy mix in 2030 compared with 2018. The estimate suggests that renewables are expected to increase by 150% and will already require planning to utilise their full potential.
This is why grid expansion and upgrades are important. However, the challenge is that this expansion is happening at the same time as electricity demand is rising.
The grid is no longer just a system that delivers electricity; it is becoming a key and increasingly costly part of the electricity system. How efficient, flexible, and large the grid is will play a major role in determining electricity prices.