The climate cost in your monthly bills
Every time fossil fuels are burned, an indirect cost is created that eventually appears in higher energy bills, insurance, food prices, and the deterioration of infrastructure.
While carbon emissions are often framed primarily as an environmental issue, their financial consequences are just as significant.
At first glance, the costs of emissions do not appear directly on our receipts, but on closer look, the economic damage becomes clear: households, governments, and future generations are all absorbing the consequences.
From reduced agricultural productivity to rising healthcare costs, and from property damage to sea-level rise, these impacts contribute to broader economic disruption.
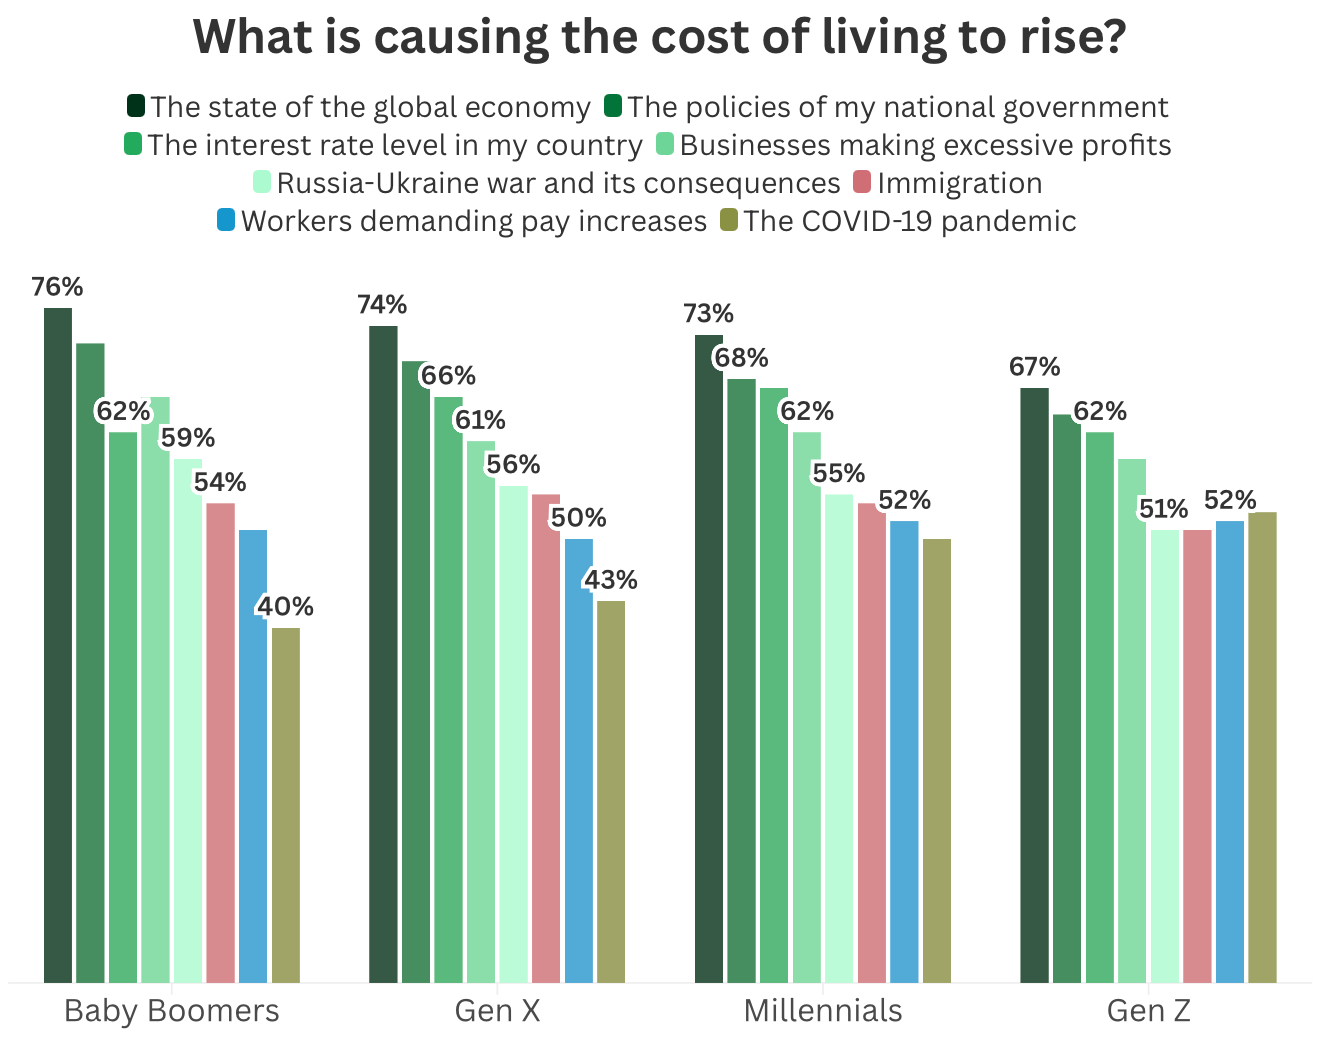
Over time, this inevitably affects the cost of living. A global survey by Ipsos, the Cost of Living Monitor, found that more than 70% of people across generations believe rising living costs are driven by the state of the global economy (Figure 1).
This includes factors such as employment, inflation, GDP growth, and financial stability. What is often overlooked is that all of these are directly or indirectly influenced by climate change.
The question is no longer whether carbon emissions carry a cost; the real issue is how those costs are distributed and how they ultimately appear in our monthly bills.
The hidden cost of carbon
This is where the concept of the social cost of carbon becomes important. It estimates the economic damage caused by each additional ton of emissions.
In simple terms, it puts a price on pollution. The U.S. Environmental Protection Agency (EPA) under the Biden administration, has used updated climate–economic modelling to estimate the following cost:
Social Cost of Carbon ≈ USD 190 per ton CO2
It represents the estimated monetary value of the total global damage caused by releasing one tonne of CO₂ into the atmosphere.
However, the number still remains controversial. Some policymakers argue that carbon pricing is too high or should be eliminated altogether, while others believe that removing it would simply shift rising climate-related costs onto the public.
When emissions are underpriced or not fully reflected in markets, the damage does not disappear; instead, it is redistributed through the economy, eventually appearing in household expenses such as higher energy bills, food prices, and insurance premiums.
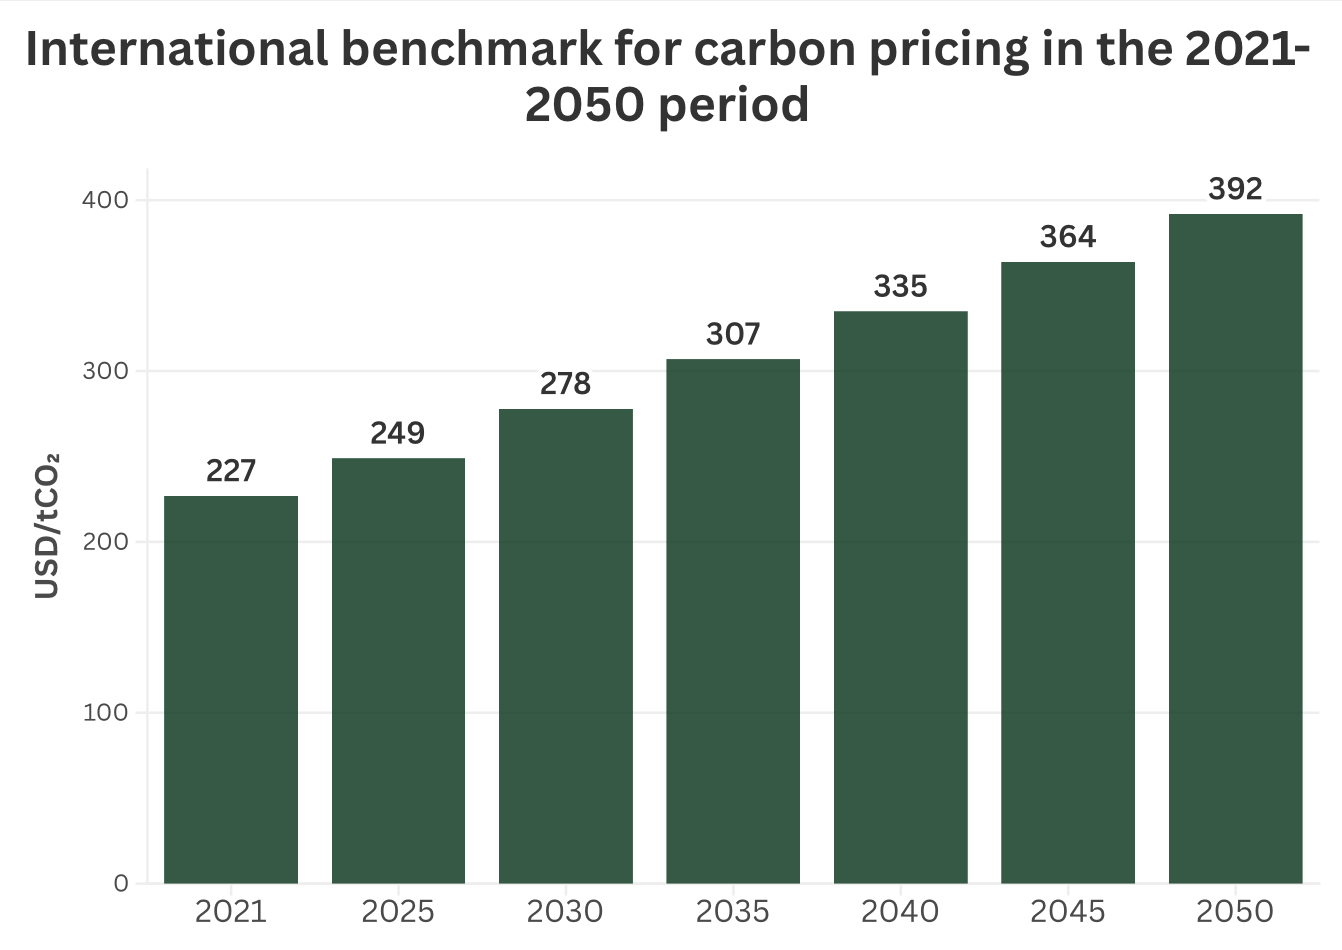
This article examines how different countries price carbon emissions and compares these values with scientific estimates of their true social cost. Figure 2 shows the optimal social cost of carbon between 2021 and 2050. The findings suggest that while such pricing could help reduce emissions, it may disproportionately affect lower-income countries compared with wealthier ones.
A 2026 Nature study by Marshall Burke and his team estimated global climate “loss and damage” using a climate–economy model linked to the social cost of carbon. The authors find that CO₂ emissions create large and unequal economic harms across countries, with a substantial share of damages materialising in the future.
For instance, they estimate that one tonne of CO₂ emitted in 1990 results in around USD 180 in damages by 2020, rising to approximately USD 1,840 by 2100. The study combines empirical temperature–GDP relationships, climate attribution models, and a 2% discount rate to quantify these long-term impacts.
Read: The critical role of power sources in the climate crisis
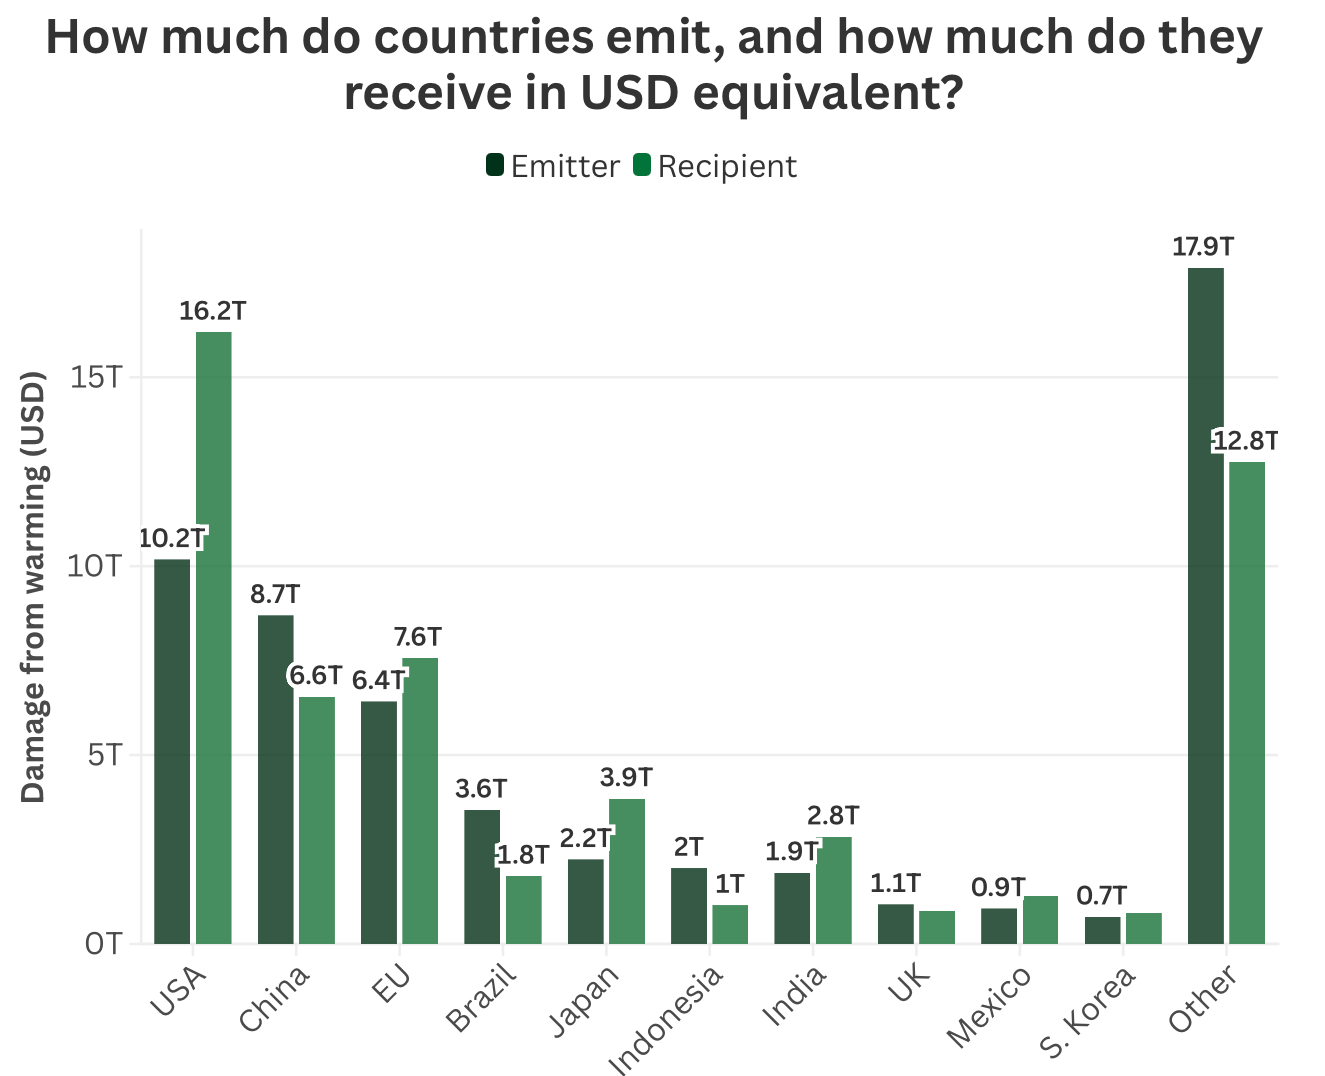
Figure 3 shows selected countries’ emissions-related damages and benefits, converted into USD equivalents for the period 1990 to 2020. U.S. emissions are estimated to have caused approximately USD 10.2 trillion in damages under a 2% discount rate.
The country also emerges as the most affected country overall among the selected ones, with total damages reaching about USD 16.2 trillion when both domestic and international impacts are included. However, it is important to note that poorer countries are often disproportionately affected relative to their contribution to global emissions.
Importantly, emitters and recipients of damages are closely linked: countries that generate high emissions also experience a substantial share of the resulting economic harm, through effects from both domestically and other regions.
Because of this imbalance, many economists argue that wealthier countries should provide greater support to poorer nations.
How carbon costs reach households
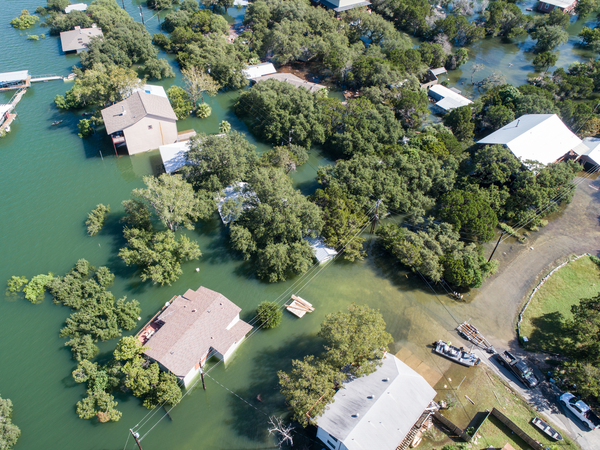
Over the next 30 years, climate-driven disasters in different parts of the U.S. could double or even quadruple, making insurance one of the most expensive components of home ownership.
Meanwhile, the Rhodium Group, a climate and economic research firm, projects that electricity demand in the U.S. could increase by as much as 9% on average over the next 15 years due to warming alone.
Read: How climate change is increasing your household bills
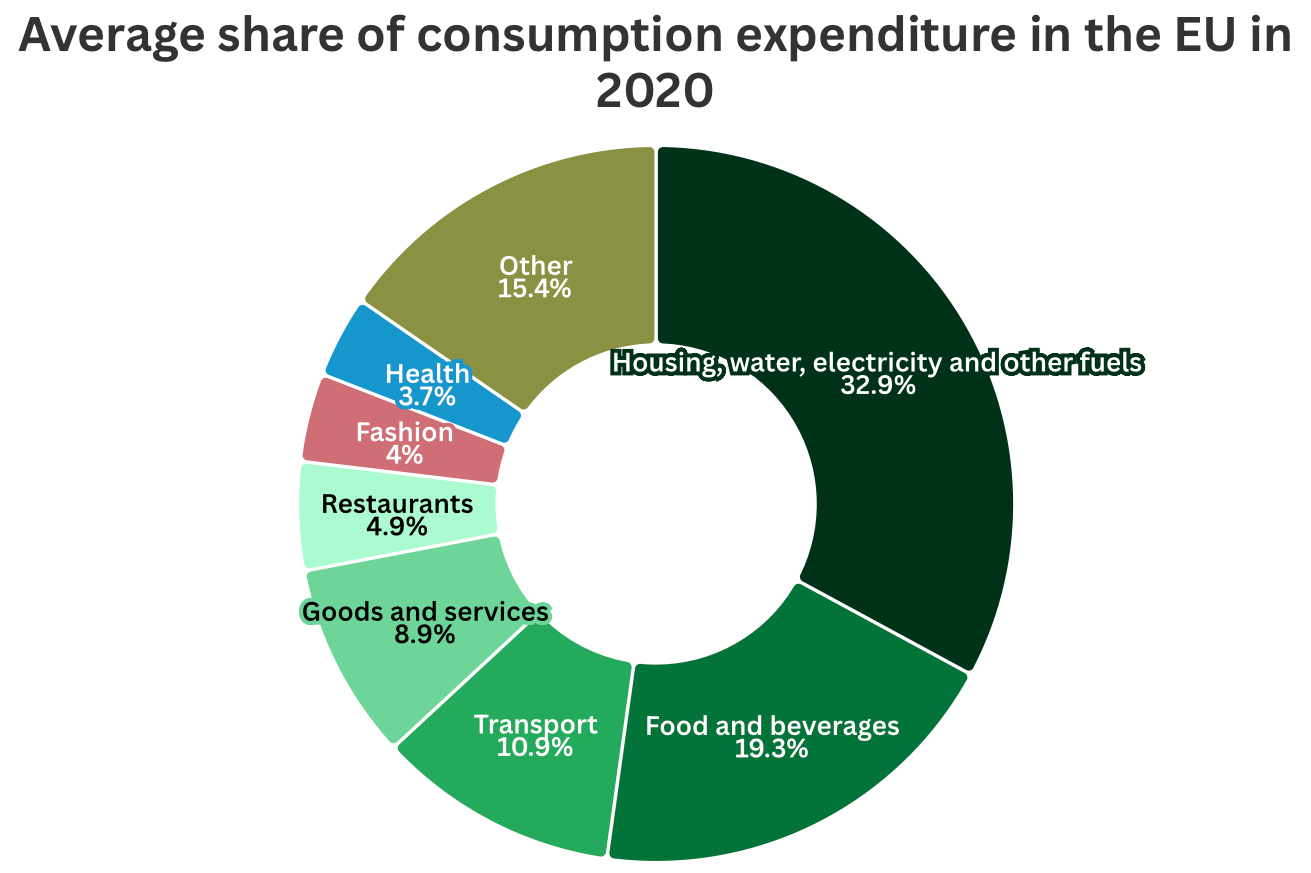
When we examine household spending, energy and food consistently account for the largest share of expenses. Figure 4 shows the average consumption expenditure in the EU in 2020, which is assumed to have remained broadly similar in recent years.
The largest categories of spending are electricity, water, and fuels, followed by food and transport. These patterns are broadly comparable across many global contexts.
This is where the impacts of climate-related costs are most directly felt:
- Energy Bills: The most immediate effect is on energy costs. As fossil fuels become more expensive through carbon pricing or regulation, electricity and heating costs tend to rise. For households, this can translate into an estimated 5–10% increase in monthly energy bills.
- Food Prices: From farming to transportation, carbon-related costs accumulate along the supply chain. As these costs rise, food prices can increase as well. Imported goods may also become more expensive, contributing to higher overall grocery bills.
- Transport Costs: Higher fuel prices driven by carbon policies can increase commuting and travel expenses.
- Insurance and Climate Risk: As extreme weather events become more frequent and severe, insurance premiums for homes and properties in higher-risk areas tend to rise due to increased exposure and payout risk.
Read: Are climate disasters destroying our real estate wealth?
Read: Is natural gas renewable or non-renewable?
Adjusting to a changing cost structure
As these pressures grow, households increasingly need to adapt to a changing cost structure. This can include improving home insulation, installing double glazing, and using energy-efficient appliances, as well as reducing car dependency, choosing local or seasonal foods, and minimising waste.
This matters because the social cost of carbon is not just a theoretical concept. It reflects, in part, the costs households are already paying indirectly for emissions they did not personally produce.
As climate-related costs become more visible in everyday life, their impact on households is likely to intensify. The challenge is not only understanding where these costs come from, but also recognising that they are already embedded in the price of modern living.